Photo: David Shankbone, CC BY 3.0
Socioeconomic Impact & Mitigation Strategies
The human cost of Sandy and the systemic changes that followed.
The surge drained within hours. The problems it exposed lasted years. Sandy did more than damage buildings. It showed how badly the most densely populated corridor in the country had underestimated its own risk.
Hazard, Exposure, Vulnerability
Disaster researchers are blunt about this: there is no such thing as a natural disaster. A disaster needs three ingredients at once. The hazard is the storm itself. Exposure is the people and property standing in its way. Vulnerability decides who can get out, absorb the hit, and recover. Sandy maxed out all three.
Hazard
Record water
A 9.4 ft surge arrived at high tide and pushed the Battery to 14.06 ft, the highest level the gauge has ever measured.
Exposure
Everything in the way
Subway tunnels, a waterfront power grid, and 650,000 homes stood in the flood's reach.
Vulnerability
Unequal footing
Age, income, insurance, housing, and transit access decided who could evacuate and who could recover. The rest of this page quantifies that.
Vulnerability itself has three parts. Sensitivity is how much harm contact with the hazard causes: a 15th-floor apartment that needs an elevator, or an oxygen concentrator that needs power. Coping capacity is what people can draw on during and right after the event: a car to evacuate, insurance, savings. Adaptive capacity is whether they can adjust before the next one: elevate the house, relocate, rebuild differently. The inequality data on this page runs along all three lines.
$88.5B
Total Damage
5th-costliest U.S. disaster (2024 $)
650,000+
Homes Damaged
Across the Eastern Seaboard
8.5M
Power Outages
Some lasting 2+ weeks
How Sandy Compares
Sandy is easy to underrate. It reached New Jersey as a post-tropical system with Category 1 winds, not a major hurricane. Set it beside the other costliest U.S. storms and the damage makes sense. Sandy brought the weakest peak winds of the group and, by a wide margin, the largest wind field.
Strength vs. Cost: Why Sandy Broke the Pattern
Each bubble is a major U.S. hurricane. Position shows peak wind against total damage; bubble area shows the storm's wind-field size.
Sources: NOAA NCEI Costliest U.S. Tropical Cyclones (2024 dollars); NHC tropical cyclone reports. Wind-field diameters approximate.
Most storms follow a simple rule: stronger winds, higher cost. Sandy sits in its own corner. A wind field close to 1,000 miles across pushed water ashore along a vast stretch of coast at once, and it did so over the priciest, most crowded stretch of shoreline in the country. Reach and location, not peak intensity, drove the bill.
Sandy Against the Costliest U.S. Hurricanes
Same six storms, ranked by the metric you choose.
Six major hurricanes ranked by cost.
Total damage, CPI-adjusted to 2024 dollars (NOAA NCEI).
Rank these storms by strength and Sandy comes last. Rank them by cost and it comes fifth, near $88 billion in 2024 dollars. That gap is the lesson for planners: record damage does not require record winds. The next pages show what that exposed target looked like.
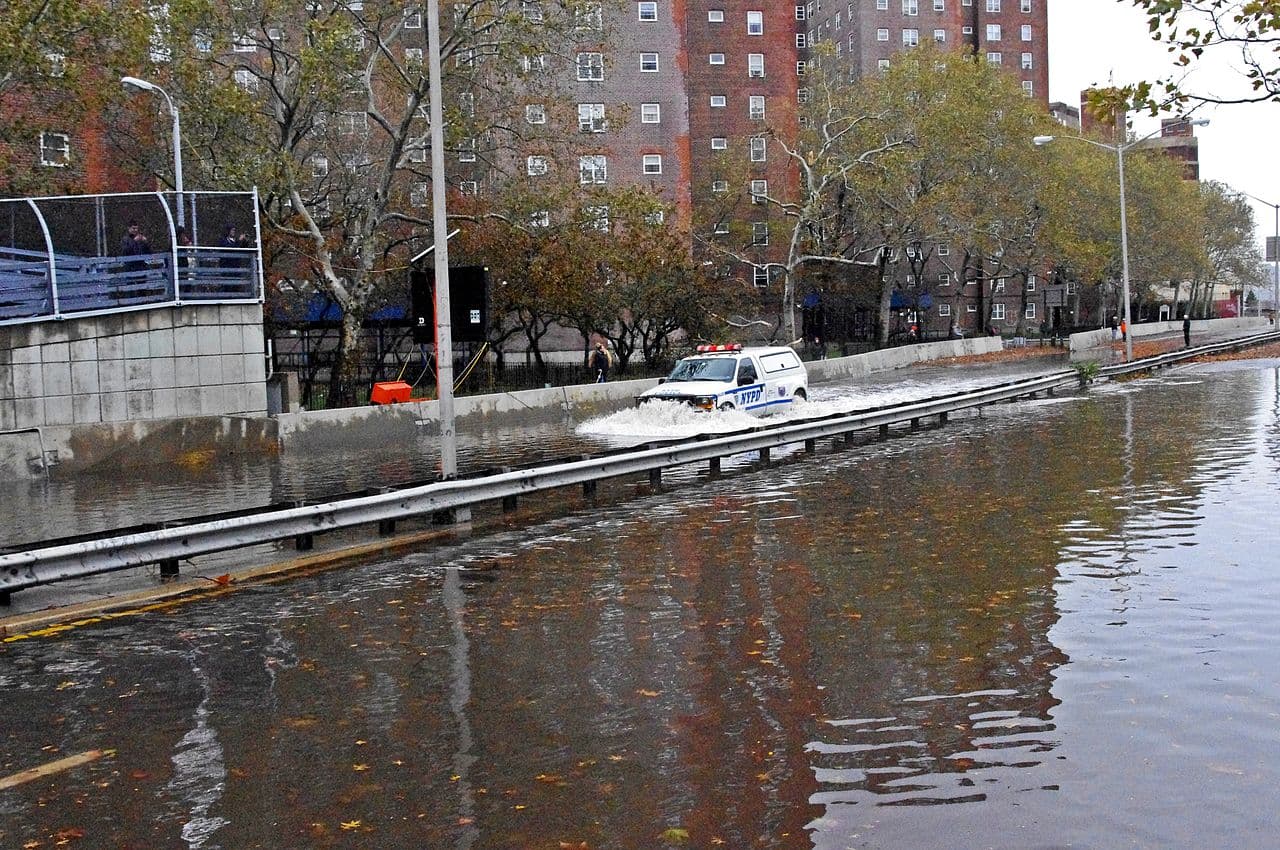
Infrastructure That Couldn't Get Wet
More than 20 million people depend on subways, tunnels, and a power grid that was never built for coastal flooding. When the surge arrived, it did not just damage that system. It shut the system down.
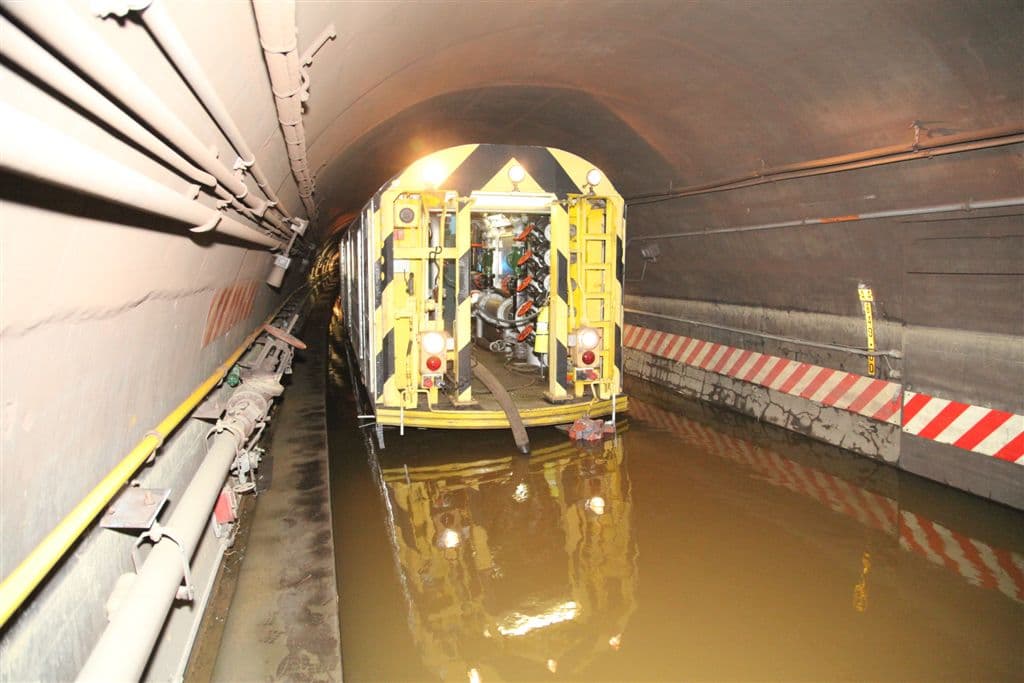
Pumping out the Cranberry Street Tunnel
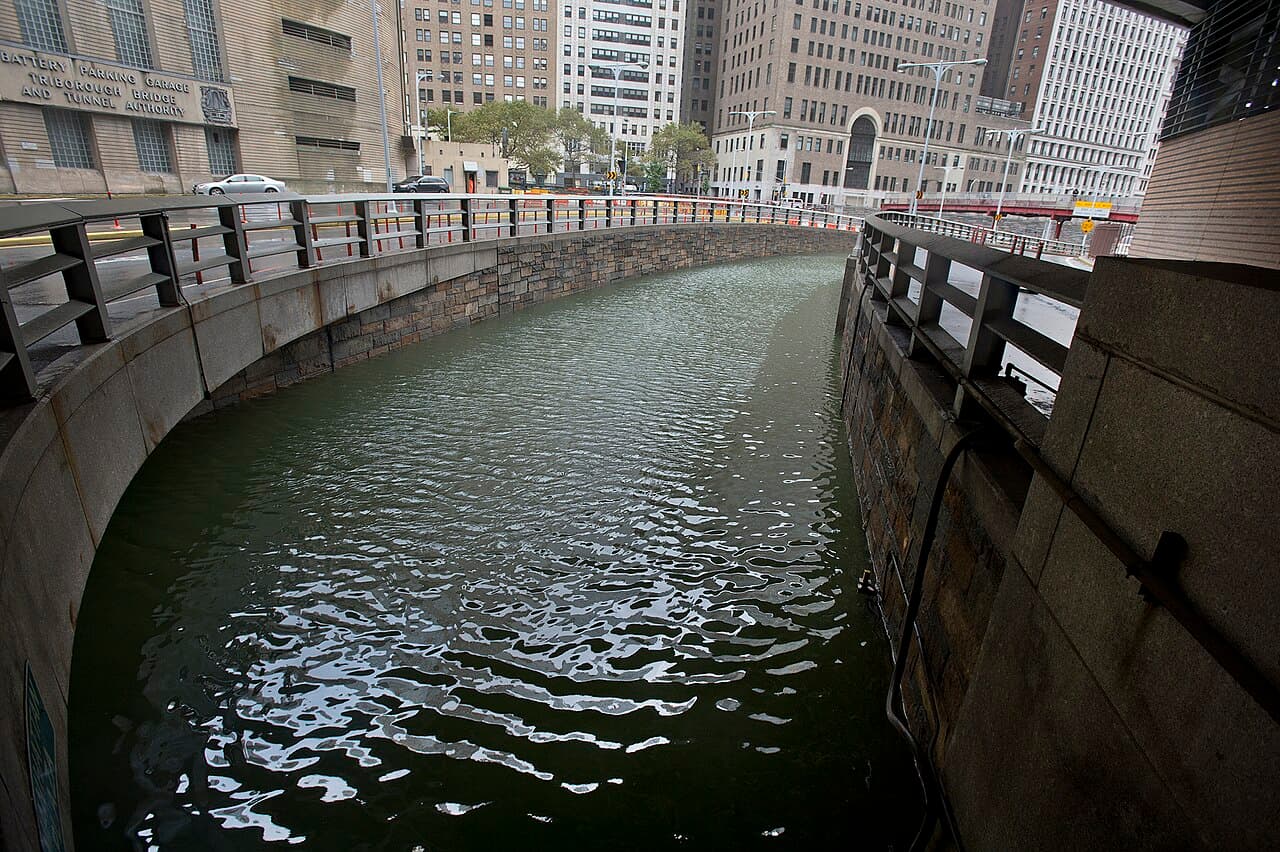
Hugh Carey Tunnel: completely submerged
Seven subway tunnels flooded. The Hugh Carey Tunnel filled completely. A Con Edison substation on 14th Street exploded on live television. Millions of people lost transit and power at the same time. The subway shutdown alone cost more than $5 billion.
The Damage Was Not Shared Equally
If you had a Manhattan high-rise, flood insurance, and a car, Sandy was a terrible week. If you were elderly, low-income, or relied on public transit, it was a months-long emergency.
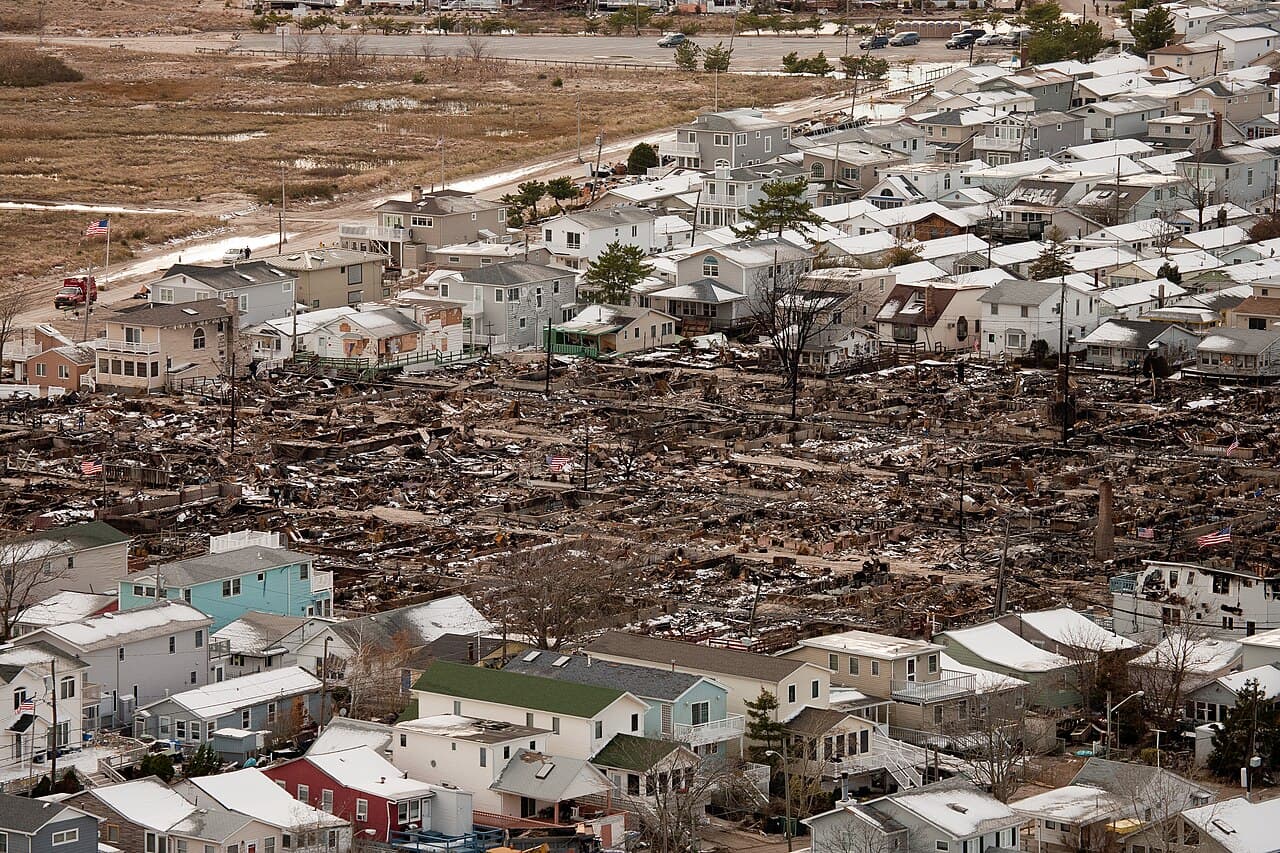
Breezy Point, Queens: 130 homes burned in a single night
80%
uninsured
Income Inequality
Only about 20% of households in the flood zone carried flood insurance. NYCHA residents lost heat, water, and power for weeks. Homeowners with coverage filed claims. Low-income families waited months, and some waited years.
~50%
deaths 65+
Elderly & Medical Vulnerability
Nearly half of the 43 direct deaths in New York City were adults over 65. Elevators stopped. Oxygen concentrators lost power. Bellevue and NYU Langone carried hundreds of patients down dark stairwells.
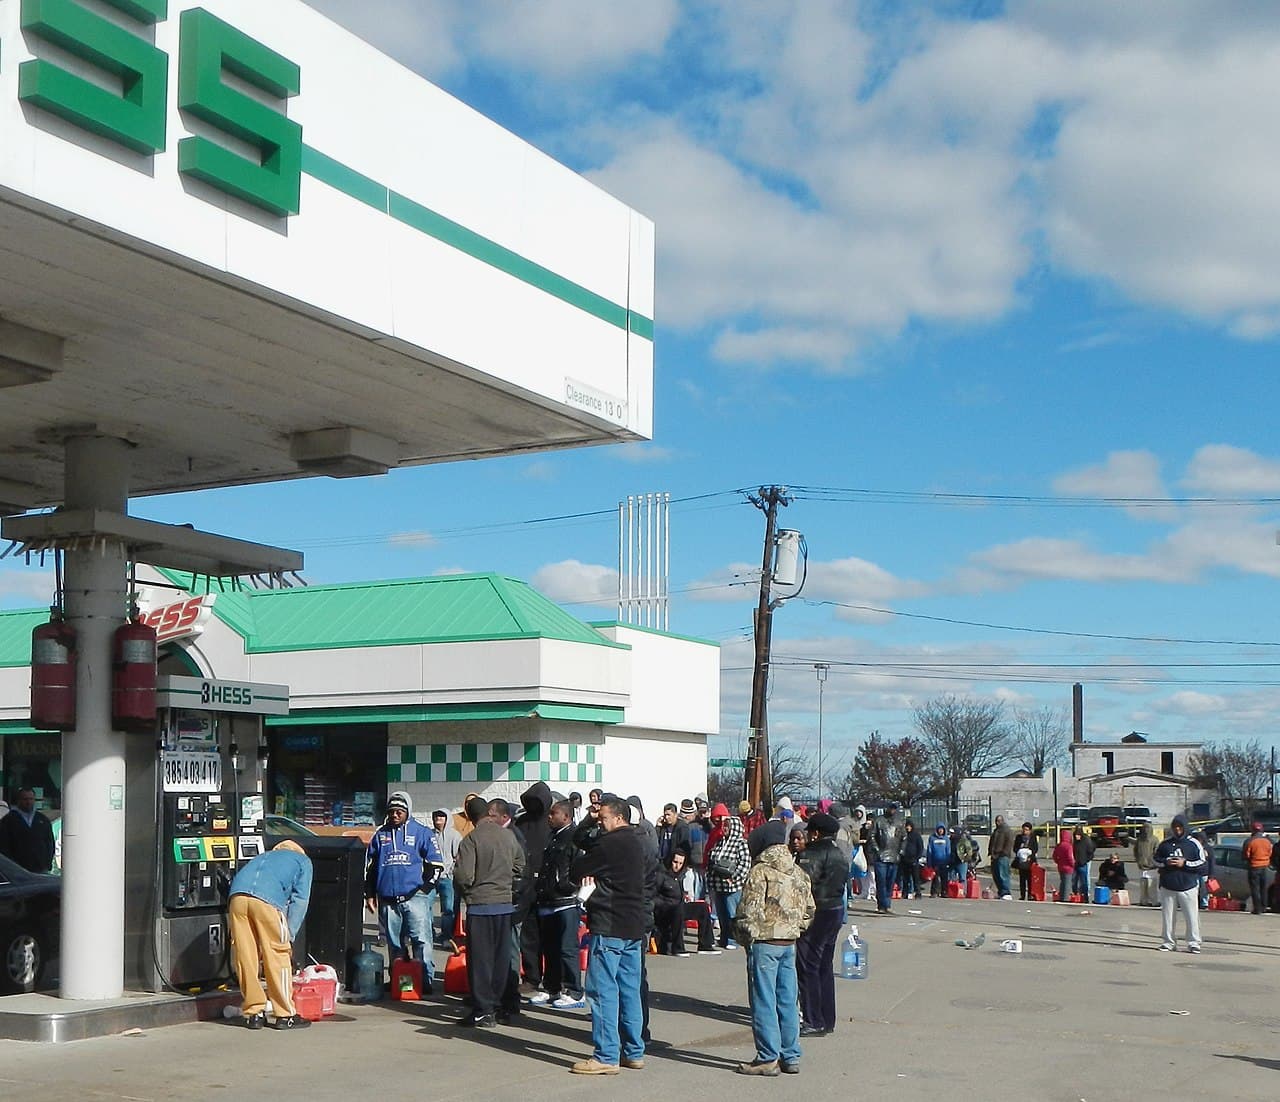
Fuel shortage: lines stretched for blocks across NYC and NJ
Picture a low-income, elderly resident on the 15th floor of a NYCHA building. There is no generator and no savings to relocate. They cannot walk 15 flights, and they need power for an oxygen concentrator. The elevator, heat, and water are all out. That intersection is what turns a storm into a humanitarian crisis.
What Changed After Sandy
Sandy set off the largest coastal resilience effort in U.S. history. New York City's recovery plan, A Stronger, More Resilient New York, committed $19.5 billion across more than 250 initiatives within eight months of landfall. The response was not one fix. It was a set of measures designed to work together.
Coastal barriers
SlowBlock surge entry into defended districts
Can favor wealthier areas without outer-borough investment.
Elevated building systems
MediumKeep power, heat, and pumps above flood level
High equity value in public housing and rentals.
Updated flood maps
MediumReveal true exposure and guide investment
Can burden low-income owners without affordability support.
Warnings and outreach
FastImprove evacuation, sheltering, and medical planning
Strongest benefit for elderly, immigrant, and transit-dependent residents.
Voluntary buyouts
SlowRemove repeated exposure where protection isn't viable
Must be voluntary to avoid forced displacement.
The Warning System Changed Too
Sandy went post-tropical hours before landfall, and 2012 policy required hurricane warnings to drop the moment that label changed. So coastal New Jersey and New York never received a hurricane warning for a storm delivering hurricane impacts. The National Weather Service rewrote the rule in 2013: warnings now continue through the transition. In 2017 it added dedicated storm surge watches and warnings, so the deadliest part of a storm like Sandy carries its own alert.
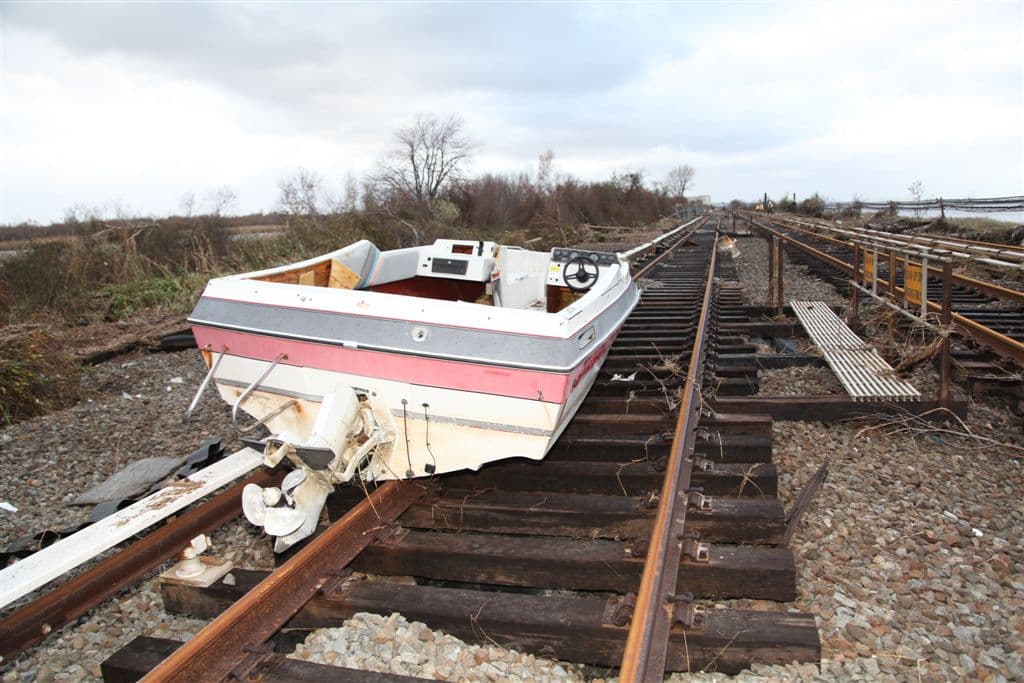
A boat on the subway tracks: the kind of image that changed policy
The Best Defense Is Layered
No single strategy is enough. Each layer catches what the one above it lets through.
- Layer 1
Coastal barriers
Lower the chance of flooding
- Layer 2
Building codes
Limit the damage when water still gets in
- Layer 3
Updated flood maps
Show where to invest first
- Layer 4
Warnings and outreach
Turn defenses into decisions people make
Together these form defense in depth, the only approach that holds when a storm exceeds any single barrier's design limit.
Our Recommendation
If leadership funds one thing this budget cycle, fund the warning and outreach layer. It is the most readily implemented strategy on the table: fastest to stand up, cheapest per person protected, and aimed at the residents the mortality data says are most at risk. It also multiplies the layers around it. Updated flood maps tell people they are in the zone, outreach turns that knowledge into an evacuation decision, and buyouts only reach households that trust the process enough to opt in. Barriers and elevation standards protect more property per dollar over decades, but they take years to permit and build. Warnings work the day they launch.
Sandy showed that resilience is not only about concrete walls. It is about who gets protected, how fast systems recover, and whether the most vulnerable people are part of the plan. That leaves one larger question. Is this going to keep getting worse?
Continue Reading
Climate Change Connection→